


- The outlook for stocks looks volatile through yearend, Ned Davis Research says.
- The research firm sees the S&P 500 struggling for several months before a yearend rally kicks off.
- There are four technical signals that point to the path ahead for stocks through the rest of 2026.
A rocky summer and a yearend rally looks like a plausible path for the US stock market for the remainder of 2026.
In a note to clients on Monday, Ned Davis Research said it sees several signals flashing in markets that outline the direction of equities in the second half. The firm’s chief US strategist, Ed Clissold, said the S&P 500 will have to ride out a spate of volatility before the bull market resumes at the end of the year.
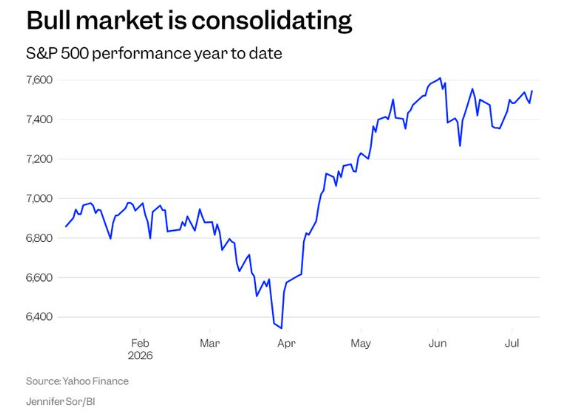
Clissold said it already looks like stocks are consolidating after a monthslong rally driven by strong earnings and a cooling of US-Iran tensions since April.
The index has pulled back recently, with traders taking profits from the semiconductor and memory sectors and fretted about the return to conflict in the war with Iran.
The S&P 500 is down less than 1% from its June peak, but is still around 8% above its 200-day moving average, a key technical support level that suggests the uptrend is still intact.
“Models are mixed, suggesting further consolidation or corrections heading into the seasonally weak third quarter,” Clissold said, pointing to a cluster of signals the firm uses to inform its outlook. “Solid long-term breadth suggests any pullbacks should be viewed within the context of an ongoing cyclical bull market,” he added.
Here are the signals Clissold said he was watching in markets:
1. Historical and seasonal patterns
Signal: Bearish
The S&P 500 Cycle Composite — a framework for stock performance based on historical patterns of how equities typically behave within a 1-year period, the four-year presidential cycle, and the 10-year decennial cycle — suggests that the market is headed for a period of weakness.
According to the model, volatility could continue through mid-August, before an early-October pullback sets the stage for the bull market to continue, Clissold said.
“Absent another news event, it is a plausible roadmap,” he added, referring to how the Iran war was an exogenous shock that caused stocks to briefly depart from the cyclical framework earlier in the year.
2. Portfolio allocation indicators
Signal: Bullish
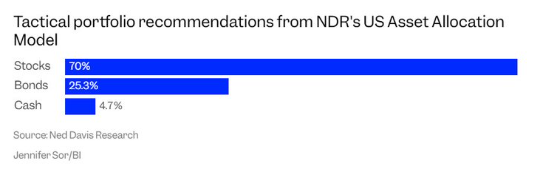
The firm’s US Asset Allocation Model, which suggests monthly “tactical” portfolio recommendations based on various market indicators, suggests that investors should be overweight stocks overall.
At the end of June, the model suggested a 70% allocation to equities — around its highest level in four years. The model recommended a 25% allocation to bonds and around a 5% allocation to cash.
3. Momentum, breadth, sentiment, and monetary signals
Signal: Bearish
Clissold pointed to NDR’s Fab Five model, an indicator for the S&P 500 based on factors such as momentum, market breadth, sentiment, monetary conditions, and other market signals. The model slipped into its “bearish zone” at the end of June, Clissold said.
“However, the weight of the evidence is far from flashing a huge warning sign,” he added, noting that several of the model’s indicators, such as momentum, breadth, and sentiment, were in “neutral” territory.
4. Market breadth
Signal: Mixed
Clissold pointed to mixed signals in breadth in particular, a measure of how many winning stocks there are in the market relative to losing stocks.
Market breadth hit a record high in early July, he said, a potential negative indicator, since a peak in market breadth “often leads cyclical peaks.”
Still, most industries in the S&P 500 look in the midst of a longer-term uptrend, he said, adding that the warning signs in market breadth looked “limited.”
“That over seven in 10 sub-industries are trending higher suggests that any seasonal weakness should be viewed within the context of an ongoing cyclical bull market,” Clissold wrote.
July 13, 2026
This Business Insider article was legally licensed by AdvisorStream
Securities and investment advisory services offered through qualified registered representatives of MML Investors Services, LLC, Member SIPC. The views and opinions expressed are those of the author(s) and may not accurately reflect those of MML Investors Services, or its affiliated companies. Local firms are sales offices of Massachusetts Mutual Life Insurance Company (MassMutual), and are not subsidiaries or affiliates of MassMutual, MML Investors Services, or their affiliated companies.
Nathan Brinkman is a registered representative and offers securities and investment advisory services through MML Investors Services, LLC. Member SIPC (www.sipc.org) Supervisory office: 8888 Keystone Crossing #1600, Indianapolis, IN 46240 (317) 469-9999. Triumph Wealth Management, LLC is not a subsidiary or affiliate of MML Investors Services, LLC or its affiliated companies. Nathan Brinkman: CA Insurance License #0C27168